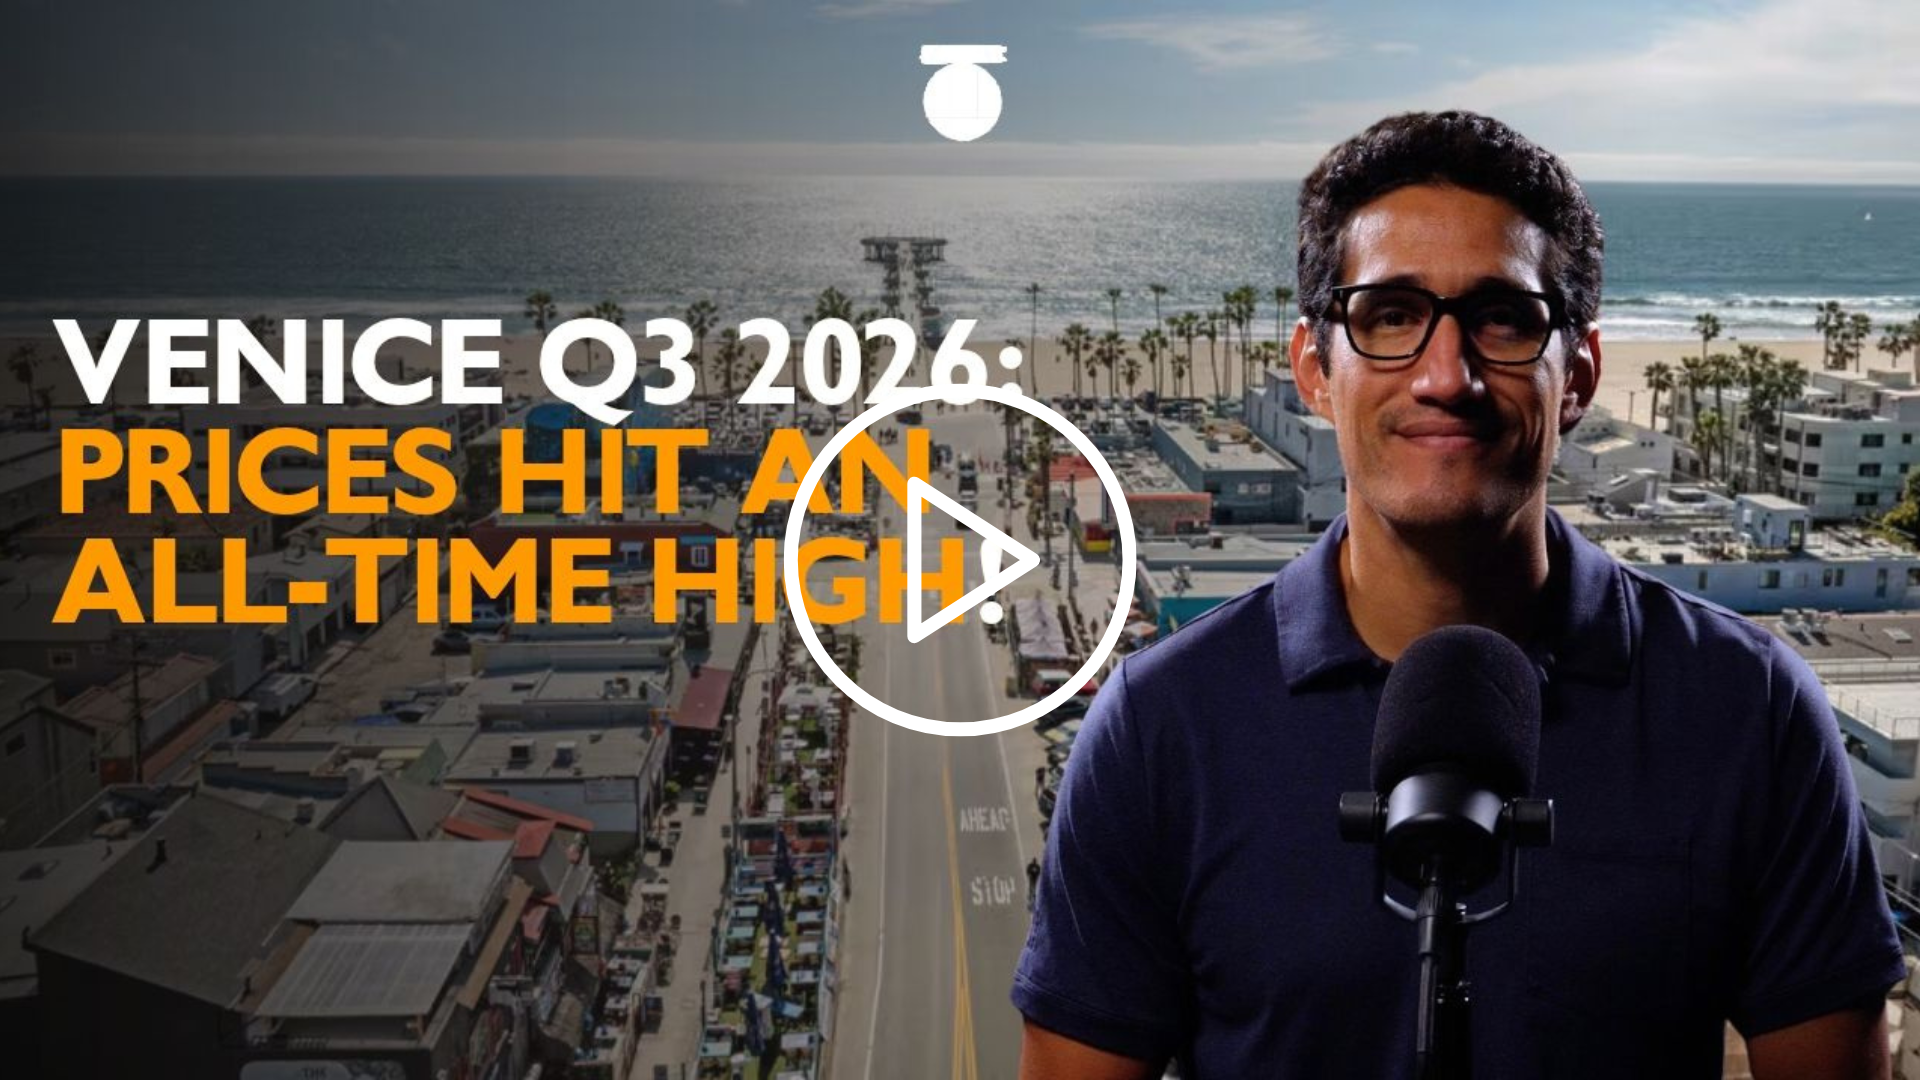
The short answer: In Q3 2026 (July through September), 62 homes sold in Venice at a median sale price of $2,365,000, down about 3% from Q3 2025. At the same time, the median price per square foot rose 4% to a record $1,413, the highest of any quarter in MLS data going back to 2012. The price dipped because smaller homes sold, not because Venice got cheaper. Homes sold in a median of 21 days and 27% went over asking. (Source: MLS, Venice single-family homes)
This summer, Venice homes got smaller and more expensive at the same time. That sounds like a contradiction, but it’s the whole story of the quarter. If you only glanced at the headline price, you'd think the market cooled off, and you'd be reading it exactly backwards. Buyers paid more for every foot of Venice than they ever have. They just bought smaller houses to do it.
Here's the full Venice housing market update for Q3 2026, covering July through September: what sold, how fast, which price ranges got hot (and which didn't), and what it all means if you own, or want to own, a piece of Venice.
How many homes sold in Venice in Q3 2026?
62 homes closed in Venice between July and September 2026, up 19% from the 52 that closed in Q3 2025 and up 7% from the 58 that closed in Q2 2026. Total sales volume came in at $167 million, up 18% from a year ago. That's Venice's 4th-biggest summer quarter ever.
| Metric | Q3 2025 | Q3 2026 | Change |
|---|---|---|---|
| Homes sold | 52 | 62 | +19% |
| Total sales volume | $141.2M | $167.3M | +18% |
| Median sale price | $2,427,500 | $2,365,000 | −3% |
| Median price per sq ft | $1,356 | $1,413 | +4% |
| Median home size sold | 1,896 sq ft | 1,717 sq ft | −9% |
| Median days on market | 34 | 21 | −13 days |
| Sold over asking | 15% | 27% | +12 pts |
| Sold under asking | 65% | 55% | −10 pts |
| Median sale-to-list | 98.2% | 98.7% | +0.5 pts |
| Active listings, end of September | 135 | 147 | +9% |
| New listings (quarter) | 92 | 124 | +35% |
| Months of supply, September | 7 | 5 | −2 |
Venice closed sales, Q3 2026 vs. Q3 2025. Source: MLS, Venice single-family homes.
Why did the Venice median price drop while price per square foot hit a record?
Think of it like your coffee order. The cup got smaller, but the price per ounce went up. The median Venice home that sold this summer was about 1,717 square feet, compared with roughly 1,900 a year earlier. That's 9% less house. So the median sale price slipped about 3%, while the median price per square foot climbed 4%, from $1,356 to $1,413. (Source: MLS, Venice single-family homes)
When the price goes down and the price per foot goes up, the neighborhood didn't get cheaper. It's product mix. This summer, more smaller homes and fewer big-ticket homes closed. That's why we always tell homeowners to watch price per square foot instead of the median. The median tells you what sold. Price per foot tells you what your home is worth.
Are Venice homes selling faster?
Yes, by almost 2 weeks. The median Venice home sold in about 21 days in Q3 2026, down from 34 days in Q3 2025. 27% of homes sold over asking, almost double the 15% from a year ago, and the median seller got about 99% of their list price.
Is Venice inventory going up?
It is, and that's where it gets interesting. There were 147 homes for sale at the end of September, up 9% from last year, and new listings were up 35%. More sellers showed up, and buyers still absorbed them faster. Months of supply actually dropped from about 7 to about 5.
What's your Venice home worth right now?
Venice changes block by block, from the canals to the walk streets to Oakwood to the Penmar side. Our team will pull the closed sales closest to your street and send you a private value range.
Get My Venice Home ValueVenice home prices by price tier: where is the money going?
The neighborhood median hides a lot. Each price range had a very different summer, so here's how Q3 2026 compared with Q3 2025, tier by tier.
| Price range | Homes sold | Share of sales | Median price | Median $/sq ft | Median days | Sold over asking |
|---|---|---|---|---|---|---|
| Under $2M | 14 → 20 | 27% → 32% | $1.67M → $1.77M | $1,358 → $1,465 | 25 → 28 | 7% → 25% |
| $2M–$4M | 30 → 36 | 58% → 58% | $2.53M → $2.54M | $1,305 → $1,411 | 35 → 15 | 23% → 33% |
| $4M–$7M | 8 → 5 | 15% → 8% | $4.65M → $5.21M | $1,411 → $1,256 | 25 → 121 | 0% → 0% |
| $7M+ | 0 → 1 | 0% → 2% | — → $8.12M | — → $2,709 | — → 288 | — → 0% |
Venice closed sales by price range, Q3 2025 → Q3 2026. Source: MLS, Venice single-family homes.
Under $2 million: it got busy. 20 homes sold here this summer, up from 14, making up about a third of all sales. The median price was $1,765,000, up 6%, and price per foot jumped from $1,358 to $1,465. A quarter of these homes sold over asking, compared with just 7% last summer. One example: a 600-square-foot cottage on Walnut Avenue sold for $995,000, about 11% over asking.
$2 million to $4 million: the heart of Venice. This range made up 58% of all sales. 36 homes sold, and the median price held basically flat at about $2,540,000. But price per foot climbed 8% to $1,411, the median time on market dropped from 35 days to 15, and a third of these homes sold over asking. This is the tier doing the heavy lifting.
$4 million to $7 million: things slowed down. Only 5 homes sold, down from 8. The median home took 121 days to sell, compared with about 25 last summer, and price per foot was down about 11%.
$7 million and above: one big one. There was exactly 1 sale, 51 27th Avenue, which closed at about $8.1 million, roughly $2,700 a foot, after 288 days on the market. One sale isn't a trend, but it shows the top of Venice is still there for the right property.
Put it together and the bottom and middle of Venice got stronger, while the top got slower. That's what pulled the median price down while price per foot went up.
What is the 12-month trend for Venice home prices?
Over the last 12 months, October 2025 through September 2026, 222 homes closed in Venice, down about 14% from 259 the year before. The median price per square foot over that stretch was about $1,320, up about 1%. So sales slowed over the full year, and prices held.
Last fall and winter, from October through March, price per foot ran about $1,274 and sellers got about 95% of their list price. From April through September, it ran about $1,359 and sellers got about 97%. That's roughly a 7% jump in 6 months. Quarter by quarter, price per foot has now gone up 3 times in a row, and this summer's jump was the biggest of the bunch. Venice had a soft winter and a firm summer, and the momentum is with sellers heading into fall.
| Quarter | Median $/sq ft | Change vs. prior quarter |
|---|---|---|
| Q4 2025 | $1,253 | — |
| Q1 2026 | $1,293 | +3% |
| Q2 2026 | $1,300 | +1% |
| Q3 2026 | $1,413 | +9% |
Venice median price per square foot by quarter. Quarterly figures are monthly MLS medians weighted by number of sales, so Q3 may differ slightly from the closed-sales figure above. Source: MLS, Venice single-family homes.
How do Venice home prices compare with 5 and 10 years ago?
10 years ago, in Q3 2016, the median price per square foot in Venice was about $1,041. Today it's $1,413, up about 36%. 5 years ago, in Q3 2021, it was about $1,237, so Venice is up about 14% from the height of the COVID market.
What most people get wrong about Venice during COVID
Everybody remembers 2020 and 2021 as the big boom, and in terms of activity, it was. Venice did $832 million in sales in 2021, still the biggest year in our data. But price per foot barely moved. It was about $1,239 in 2018 and actually dipped to about $1,106 in 2020. The Venice boom was about how many homes sold, not how much each foot was worth.
Then rates jumped in 2022 and 2023, and Venice did something different. Sales fell from 337 in 2021 to 181 in 2023, but price per foot held around $1,300. Buyers got pickier. They didn't get cheaper.
| Year | Homes sold | Median $/sq ft | Sales volume |
|---|---|---|---|
| 2016 | 207 | $1,132 | $450M |
| 2017 | 207 | $1,149 | $469M |
| 2018 | 203 | $1,239 | $472M |
| 2019 | 171 | $1,154 | $394M |
| 2020 | 214 | $1,106 | $488M |
| 2021 | 337 | $1,216 | $832M |
| 2022 | 280 | $1,332 | $766M |
| 2023 | 181 | $1,238 | $498M |
| 2024 | 206 | $1,286 | $532M |
| 2025 | 242 | $1,305 | $679M |
| 2026 (Jan–Sep) | 174 | $1,338 | $477M |
Venice sales by year. Medians are monthly MLS medians weighted by number of sales. Source: MLS, Venice single-family homes.
Is Venice back at 2022 levels?
Pretty close on price, with one big difference. Compared with a typical pre-COVID summer (2017 to 2019), Venice is selling a few more homes (62 vs. about 54), selling them faster (21 days vs. about 35), and each foot is worth about 18% more. The closest match in the history is the summer of 2022, when price per foot ran about $1,363.
The difference is inventory. In summer 2022 there were about 106 homes on the market at any given time. This summer there were about 144. Through the first 9 months of 2026, the median price per foot is about $1,338, on pace to edge out 2022 as the highest year in our data. That's not a frenzy. It's a market that's simply worth more, with buyers who have options.
What does the Q3 2026 Venice market mean for sellers and buyers?
If you're selling under $4 million, this is a good setup. Homes are selling faster than last year, a third are going over asking in the $2 million to $4 million range, and price per foot is at a record. Price it right, prep it well, and you're selling into strength.
If you're selling above $4 million, be patient and be realistic. That tier is taking months, not weeks, and the buyers there are negotiating.
If you're buying, you have more inventory than last year, but the lower winter pricing is gone. In the $2 million to $4 million range, good homes are going in about 2 weeks, so have your financing ready before you fall in love. Above $4 million, you have real leverage, so use it.
Frequently Asked Questions
Are Venice home prices going up or down in 2026?
Price per square foot is going up. In Q3 2026, the median price per square foot in Venice hit a record $1,413, up 4% from Q3 2025 and up three quarters in a row. The median sale price dipped about 3% to $2,365,000 because more of the homes that sold were smaller, not because Venice homes lost value.
How long does it take to sell a home in Venice, CA right now?
The median Venice home sold in 21 days in Q3 2026, down from 34 days in Q3 2025. Homes between $2 million and $4 million sold in a median of 15 days, while homes between $4 million and $7 million took a median of 121 days.
Are Venice homes selling over asking?
More often than last year. In Q3 2026, 27% of Venice homes sold over asking, up from 15% in Q3 2025. In the $2 million to $4 million range, a third of homes sold over asking.
Is now a good time to sell a house in Venice?
For homes under $4 million, the setup is strong. Price per square foot is at a record, homes are selling faster than last year and more of them are going over asking. Above $4 million, sellers should plan for a longer timeline and buyers who negotiate.
Is now a good time to buy a home in Venice?
Buyers have more choice than last year, with 147 homes for sale at the end of September 2026, up 9%. The lower winter pricing is gone, though, and good homes between $2 million and $4 million are selling in about 2 weeks, so have your financing ready. Above $4 million, buyers have real negotiating leverage.
Curious what this means for your home?
The headline median doesn't tell you what your home is worth. Price per square foot and the sales closest to your street do. If you own in Venice or you're thinking about buying here, call the Paul Salazar Group at 310-853-2643 or email info@paulsalazargroup.com. We'll put together a real number for you, no pressure. Request your free Venice home value.
Data in this report comes from the MLS for single-family homes in Venice, CA. Q3 figures are calculated from individual closed sales for July 1 to September 30 of 2025 and 2026. Multi-year, quarterly and rolling-window figures are monthly MLS medians weighted by number of sales. Information is deemed reliable but not guaranteed and is not a valuation of any individual home.